Tips
Tutorial
The Instagram Metrics That Actually Matter
7
min read
Apr 24, 2025
Written by:
Jessie Welsh

Instagram Insights can feel like a flood of confusing numbers. We have terms like reach, impressions, saves, and profile visits, but which ones really impact your goals?
Not all metrics deserve your attention. Sometimes, focusing on the right numbers makes all the difference between spinning your wheels and driving real growth.
This article breaks down which Instagram metrics actually matter, why they’re important, and how to use them to make smarter content decisions.
Reach vs. Impressions

You’d think they mean the same thing, right? Not quite.
Reach is how many unique users saw your content. On the other hand, impression is how many times your content was seen, even if by the same person five times.
These two metrics get mixed up constantly, but they tell you completely different things.
The gap between these numbers reveals how often people are coming back to your content. A high impression-to-reach ratio means viewers found your content compelling enough to look at multiple times.
Let’s say you post a carousel about social media tips, and it gets 1,200 impressions but only 700 reach. That means your content was seen, on average, nearly twice by each viewer. That’s not a bad thing. In fact, it usually means your content is sticking, maybe even saving worthy.
Here’s a pro tip for you. It’s better to see steady reach growth than viral spikes.
Virality feels great in the moment, but it often attracts the wrong audience. You get the numbers, but not the conversions.
Instead, the goal is to get consistent reach growth week after week. That means your content is gradually expanding your circle.
Engagement Rate
Engagement rate remains the holy grail of Instagram metrics, but the way we calculate it has evolved. Simply dividing likes and comments by follower count doesn’t cut it anymore.
There are a few ways to calculate it, but the most common one is:
(Total Engagements / Total Reach) x 100
That includes likes, comments, saves, and shares. The last two metrics are the secret sauce. Both saves and shares show that your content has lasting value.
A healthy engagement rate hovers between 3-6% for most niches and 10-15% for more specialized communities. If you’re below 1%, you need to do something about your low engagement.
Profile Activity
For businesses and content creators, profile visits and website clicks represent the transition from passive consumption to active interest.
When people click over to your profile after seeing a reel or story, it means something caught their eye. Maybe it was the hook. Maybe it was the aesthetic.
Either way, they’re curious, and that’s your moment to shine.
As someone managing an Instagram account, tracking the ratio of profile visits to follower growth reveals a lot about audience quality. If lots of people visit the profile but don’t follow, your content might be interesting, but not aligned with what people want in their feeds long-term.
Likewise, low engagement but high profile visits can actually be a positive sign. It means your content is attracting the right audience who wants to know more, even if they’re not necessarily double-tapping.
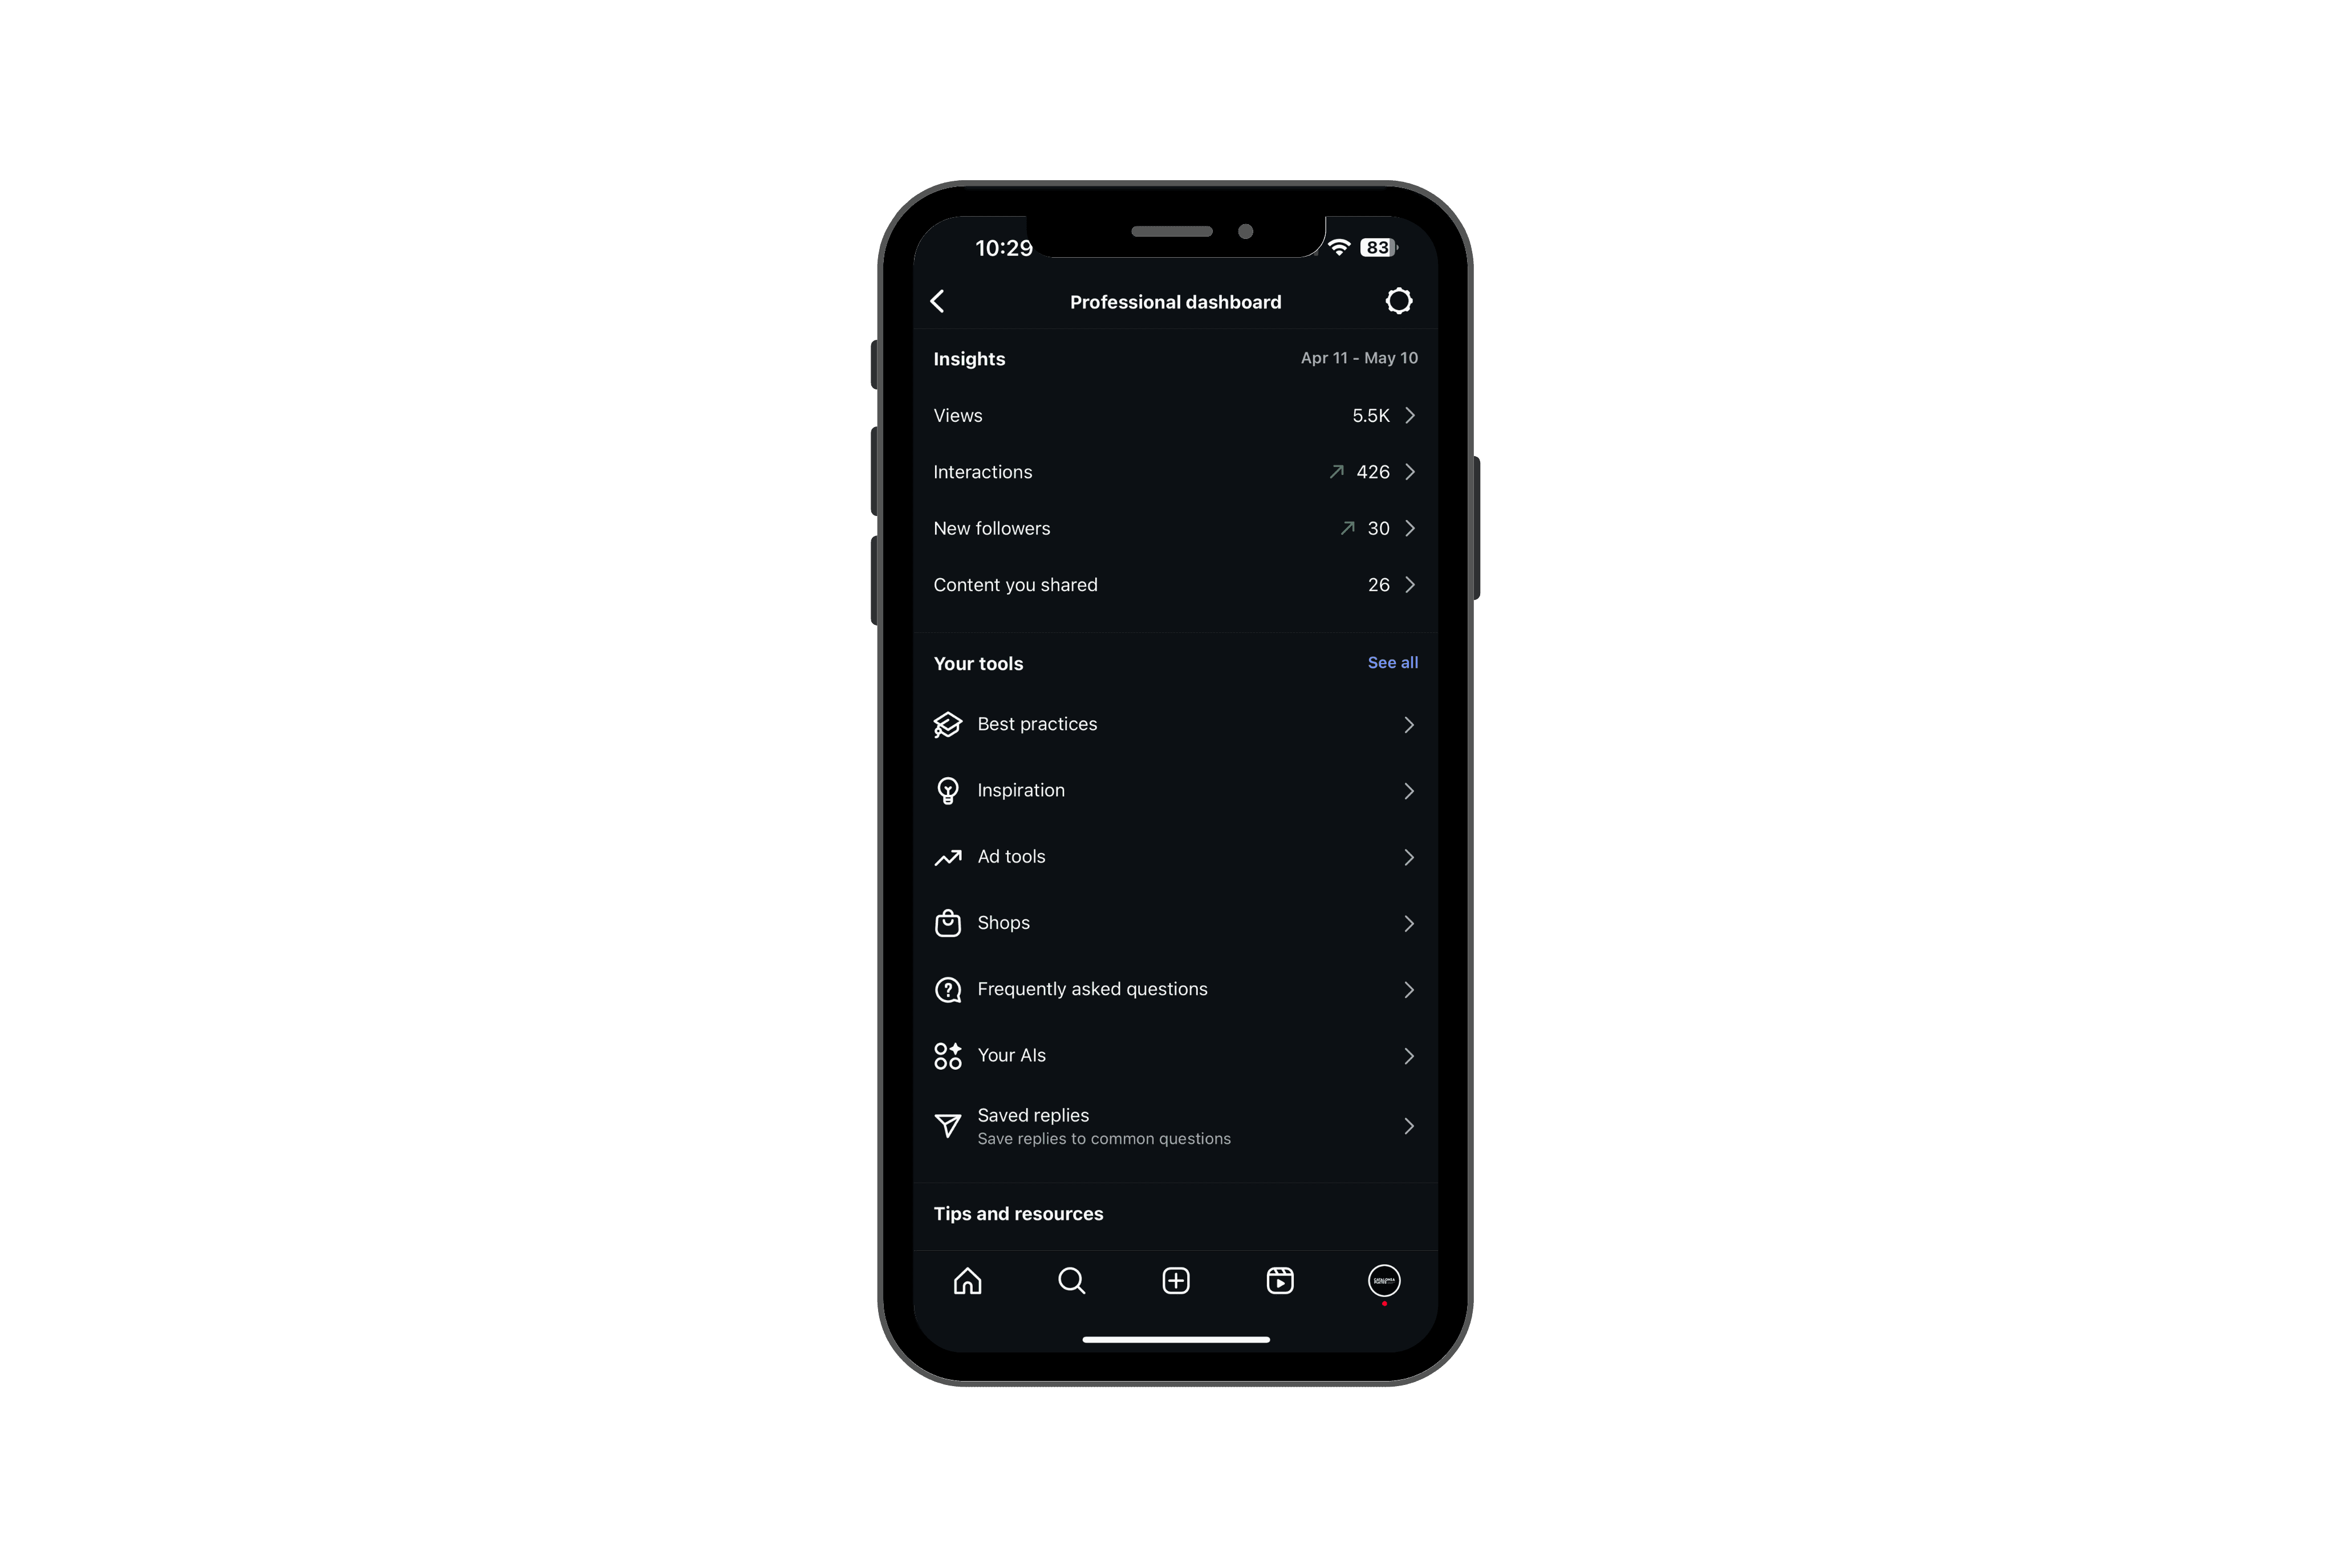
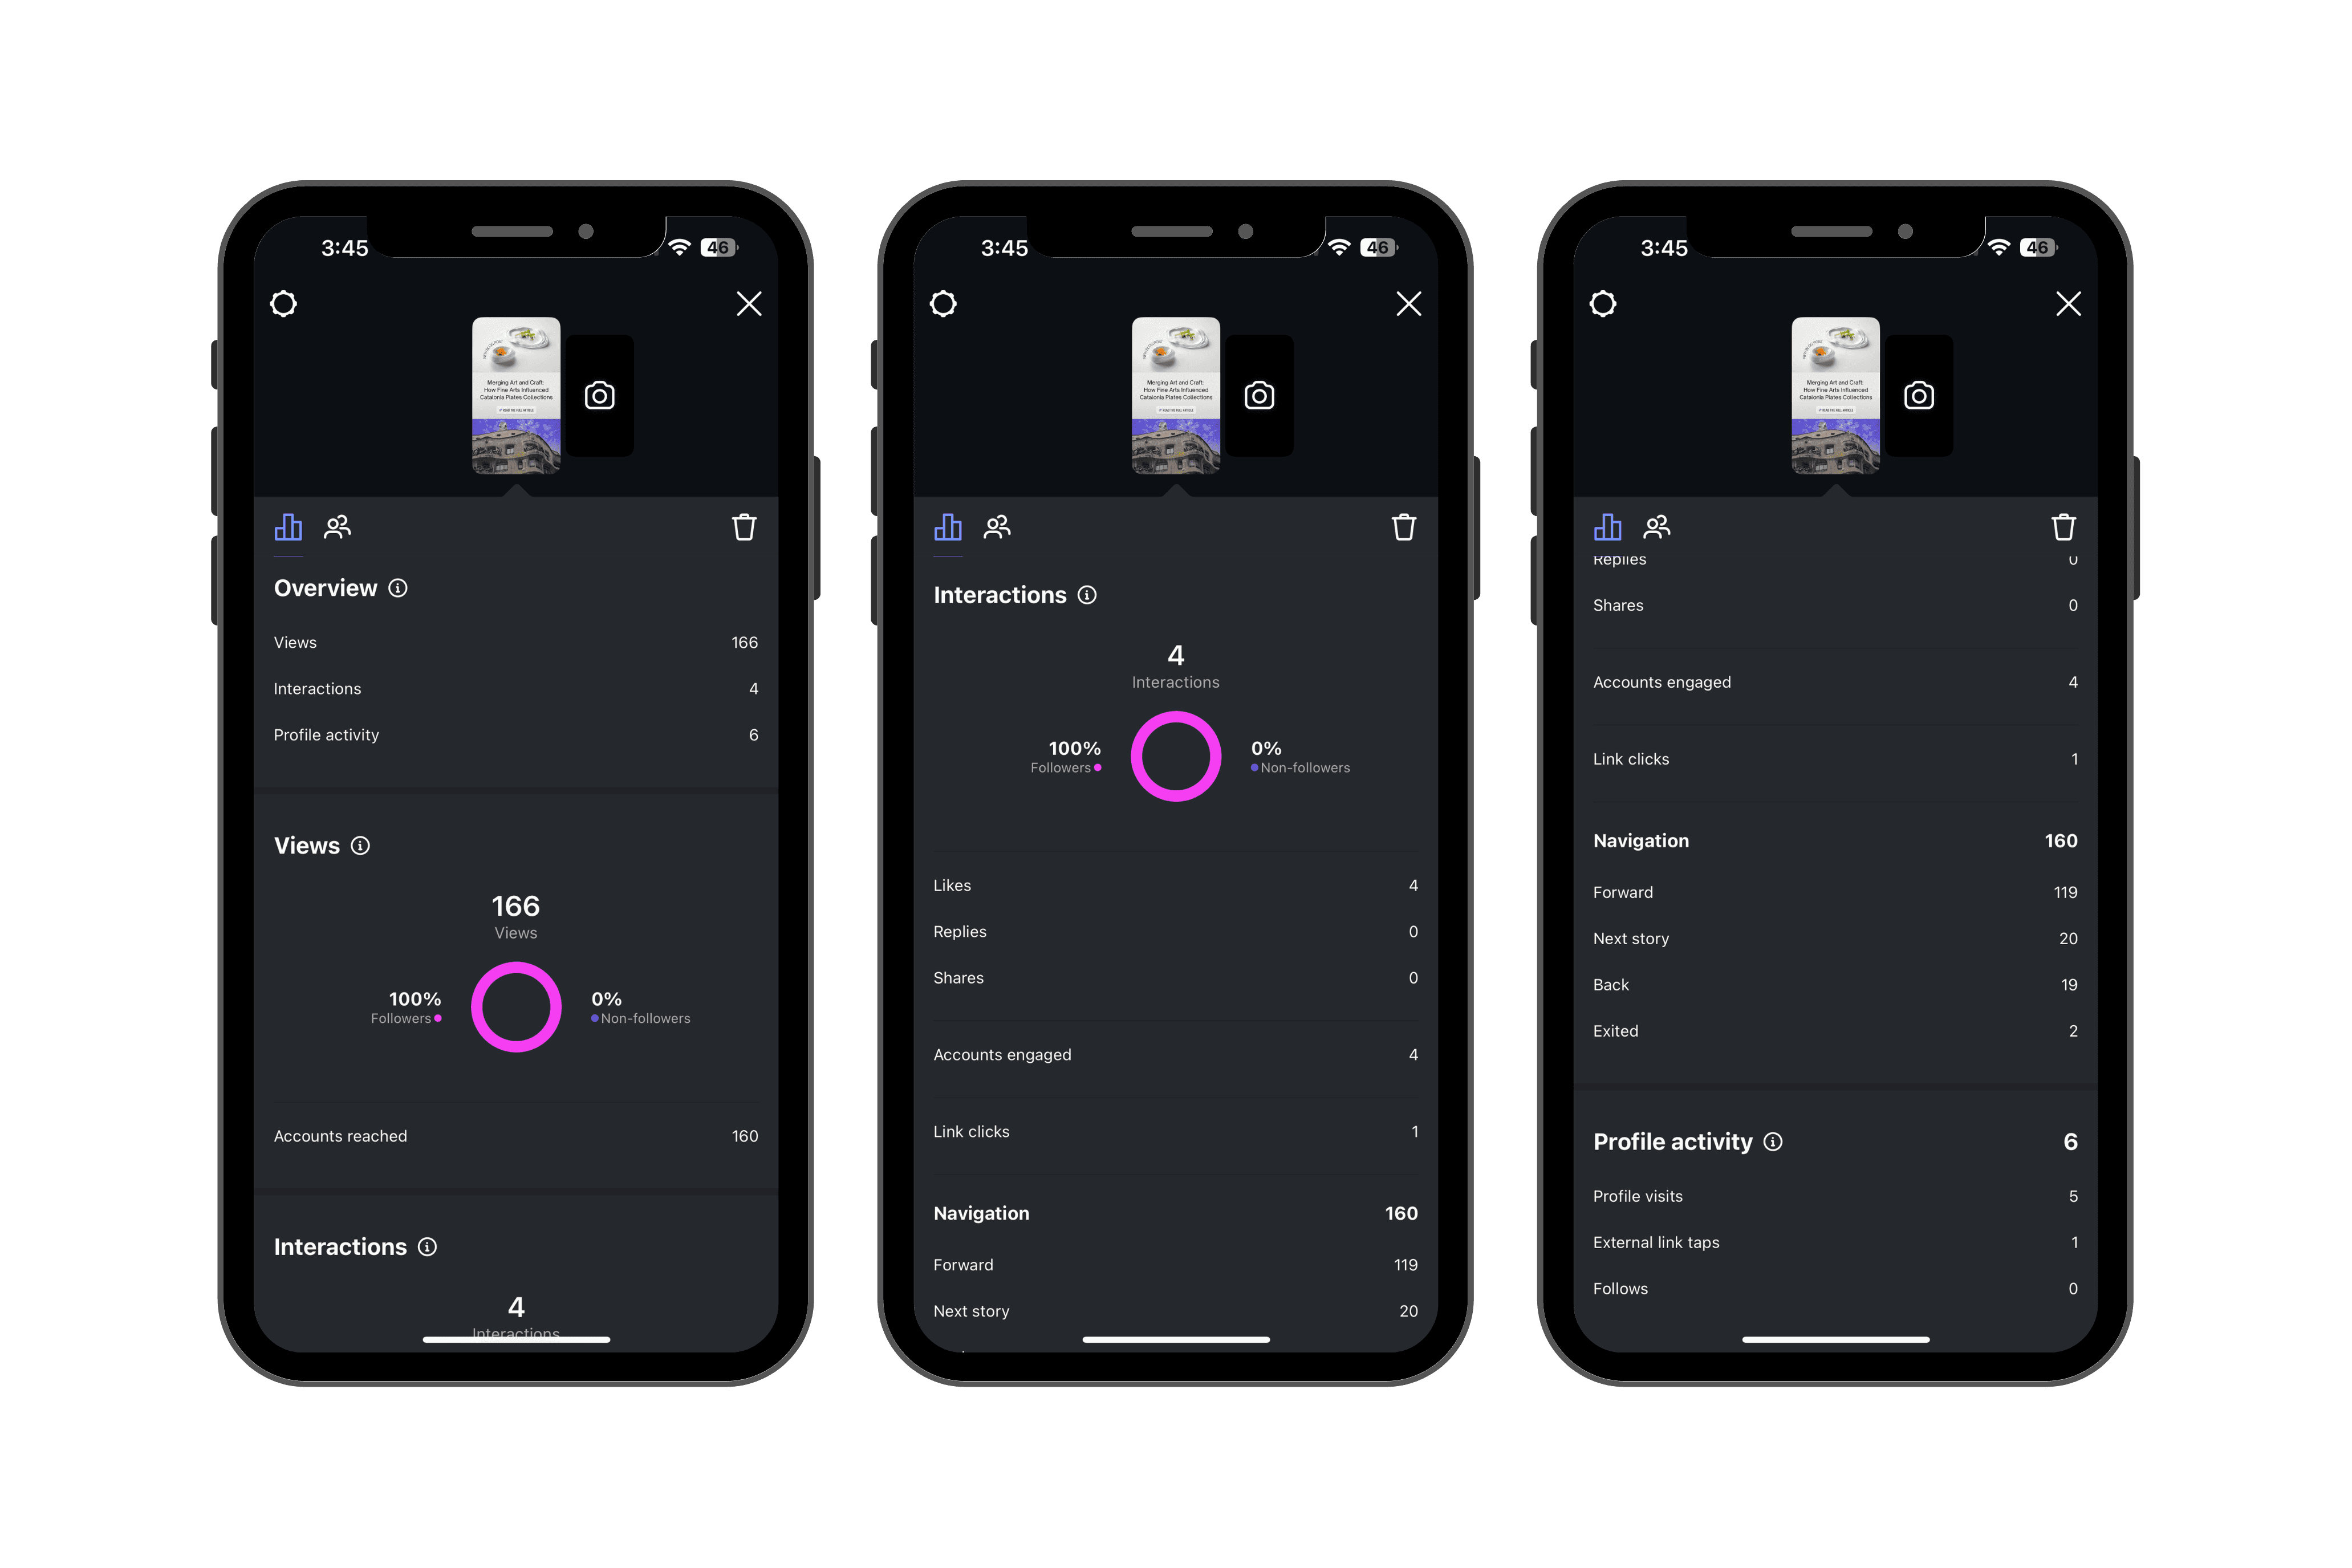
In the Instagram Professional Dashboard, you can track the following:
Profile visits: The number of times your profile was visited
External link taps: The number of taps on any of the links on your Instagram profile, excluding taps on your connected Facebook profile
Business address taps: The number of times your business address on your profile was tapped
Instagram Saves
If you’re not watching saves, you’re missing out on perhaps the strongest signal in Instagram’s current algorithm.
When someone saves your post, they are essentially telling Instagram, “This is so valuable I want to reference it later.”
Posts with high save rates consistently outperform in future reach, regardless of other engagement metrics. Content types that often get high saves are the following:
Educational content
Infographics
Carousels with tips
Lists
Step-by-step tutorials
Other resource-type posts
Story Metrics
Instagram Stories have become central to most strategies, but are people actually watching yours all the way through?
Story completion rate measures the percentage of people who watch your entire Story sequence from the first frame to the last. This metric tells you whether your content is captivating enough to hold attention or if viewers are dropping off.
Anything above 70% completion is excellent. Below 50%? Then, your IG Stories need some work.
Aside from the completion rate, you need to pay attention to the following:
Taps back: Are your followers rewatching your Stories?
Replies: Are your Stories sparking real conversations in the DMs?
Sticker taps: Are your audience members actually engaging with your polls, quizzes, or sliders?
Exits and Skips: Are people dropping off before your Story finishes, or skipping it altogether?
Reels Performance

The current Instagram algorithm is giving this feature extra love. That’s why Reels tend to rack up more reach compared to feed posts or even Stories. But don’t be fooled by views alone.
If you’re seeing 10K views but almost no interaction? Something’s off. Maybe your hook was strong, but the content didn’t deliver. Or maybe it was catchy, but not on-brand enough to convert casual viewers into a community.
Instead of views, you need to keep an eye on watch time and replays, shares, and follows after posting the reel. These are some of the metrics that will help you gauge if your reels strategy is working.
Follower Growth

Watching your follower count tick upward feels great and validating. But raw follower numbers are vanity metrics without context. What really matters is your follower growth rate or the percentage increase in followers over time.
A healthy account should see consistent growth of 2-5% monthly. You should also consider audience consistency, location relevance, and behavior patterns when it comes to tracking follower growth.
Your new followers should be aligned with your niche and located near you, especially if you have a local business. If most of your followers are in a completely different country or time zone, you might be posting when your actual target audience is asleep.
That’s why you should always chase growth. But make sure it’s quality over quantity. Because 500 loyal followers who engage, buy, and talk about your brand are worth more than 50,000 silent ones who scroll right past.
Let Loopify Do the Heavy Lifting
If you’re a brand or a content creator trying to outwit the algorithm with a clever Reel, always remember that context and consistency always beat clout.
Not every post will land. Not every Story will convert. That’s okay.
What matters is that you’re paying attention to the right signals, adjusting with purpose, and building a strategy that evolves as your audience does.
Loopify can help you with all that. Count on us for streamlined scheduling, real-time insights, and smooth management for your content strategy.
From growth trends to engagement metrics, you can get a clear overview of how your content is performing across platforms, all in one unified view.
Join the waitlist today and be the first to know when we launch!